
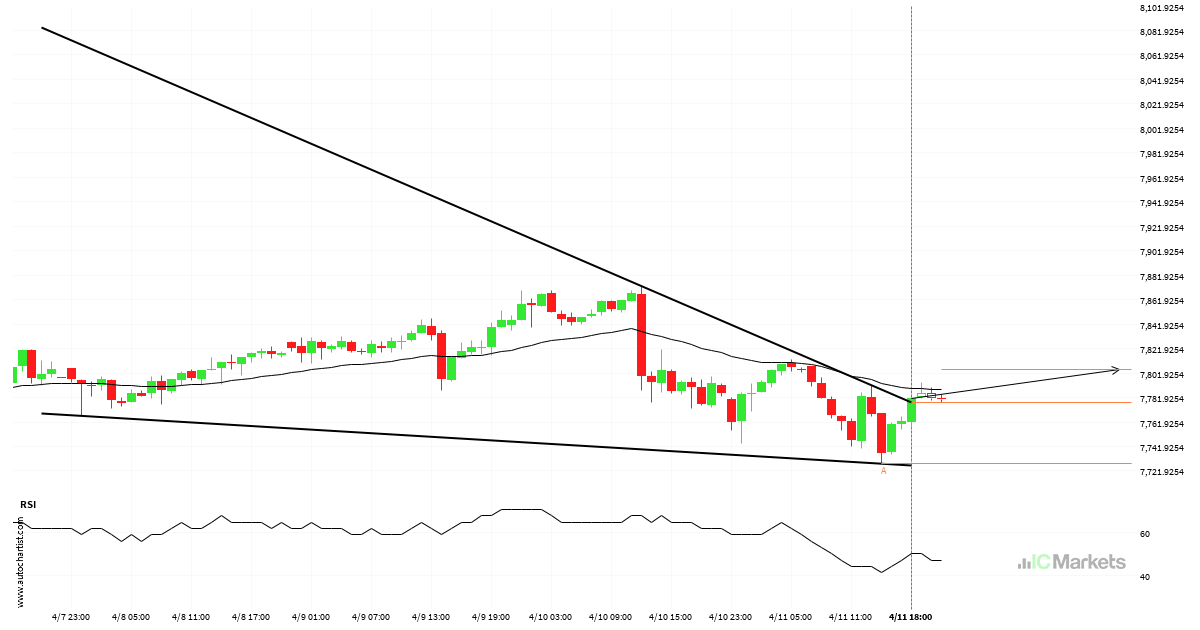
Possibility of big movement expected on Australia 200 Index
The breakout of Australia 200 Index through the resistance line of a Falling Wedge could be a sign of the road ahead. If this breakout persists, we may see the price of Australia 200 Index testing 7805.1709 within the next 2 days.
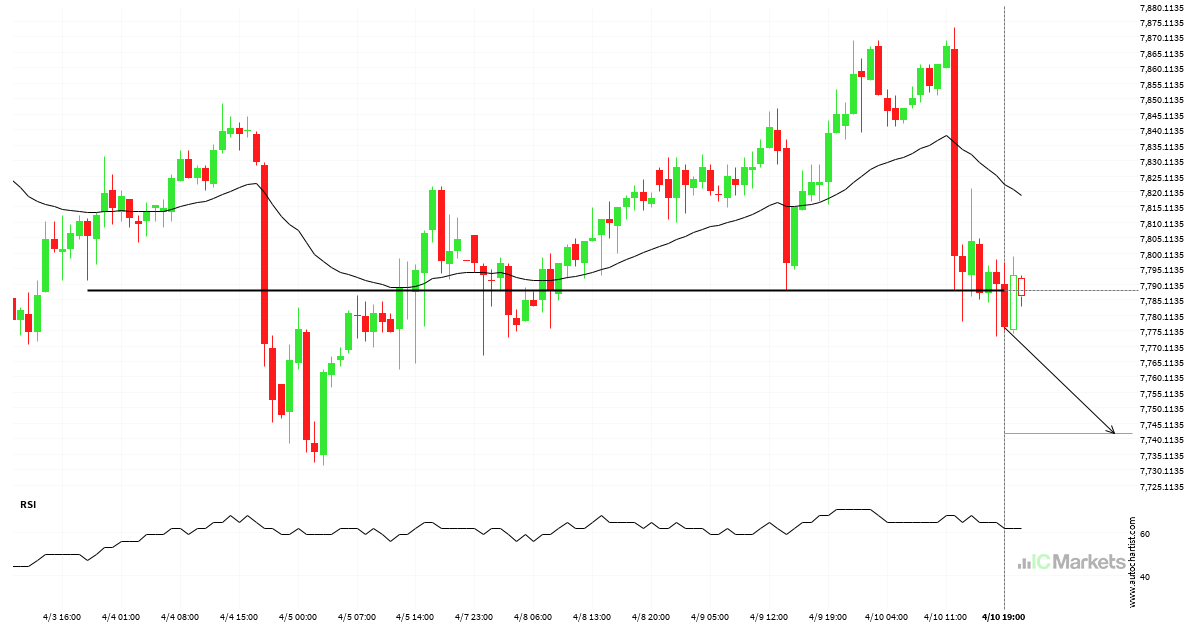
Hong Kong 50 Index – Continuation Chart Pattern – Channel Up
Hong Kong 50 Index is approaching the support line of a Channel Up. It has touched this line numerous times in the last 16 days. If it tests this line again, it should do so in the next 22 hours.
Australia 200 Index breakout through support
Australia 200 Index has broken through a support line. It has touched this line numerous times in the last 8 days. This breakout shows a potential move to 7741.7290 within the next 2 days. Because we have seen it retrace from this level in the past, one should wait for confirmation of the breakout.
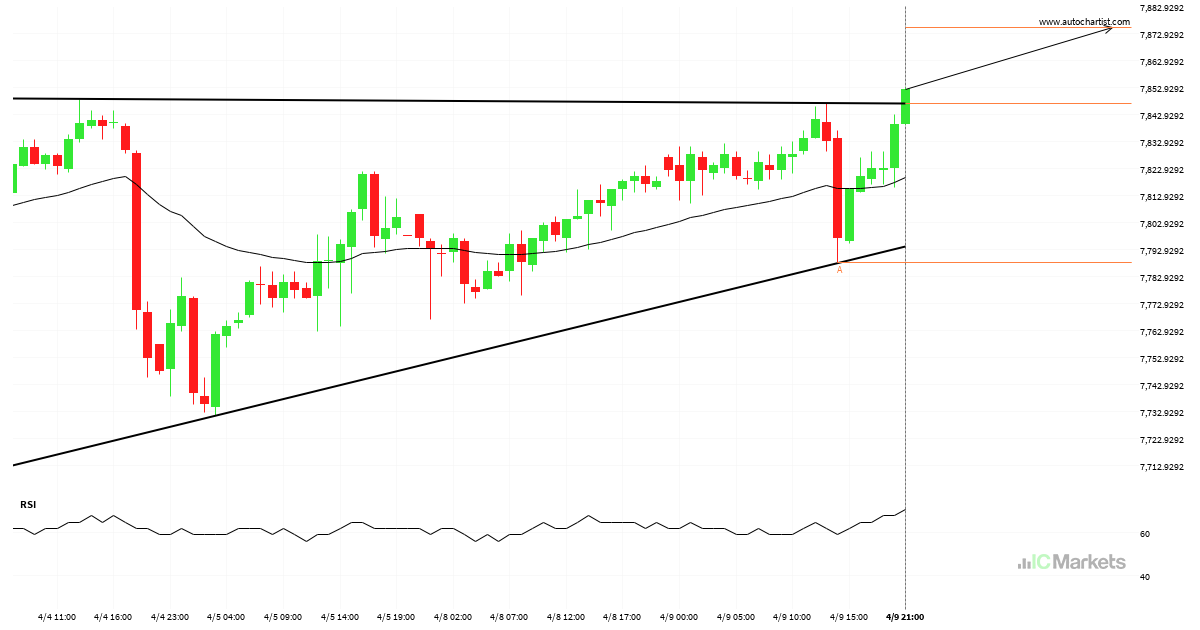
Continuation pattern on Australia 200 Index
This trade setup on Australia 200 Index is formed by a period of consolidation; a period in which the price primarily moves sideways before choosing a new direction for the longer term. Because of the bullish breakout through resistance, it seems to suggest that we could see the next price move to 7874.8431.
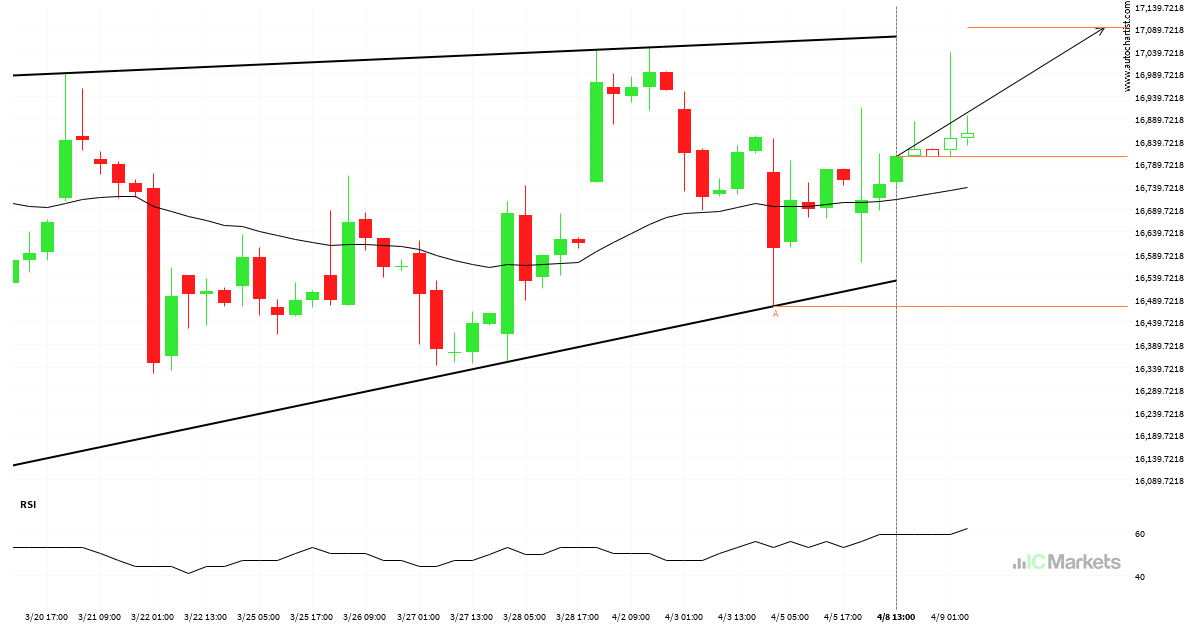
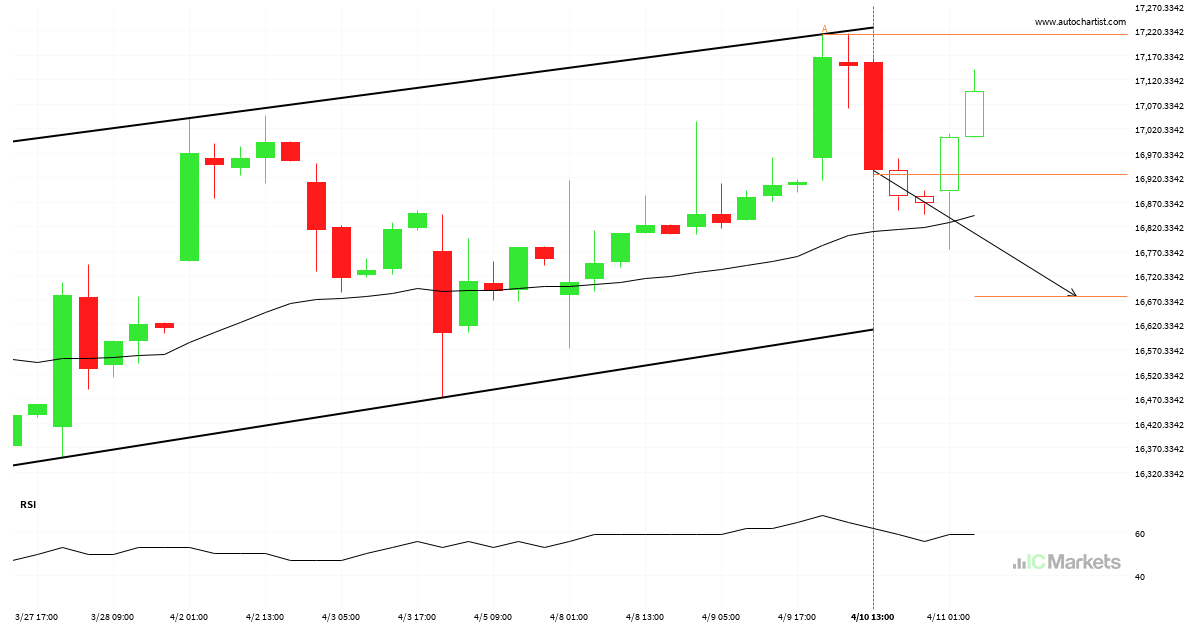
Hong Kong 50 Index – getting close to resistance of a Rising Wedge
Hong Kong 50 Index is approaching the resistance line of a Rising Wedge. It has touched this line numerous times in the last 20 days. If it tests this line again, it should do so in the next 2 days.
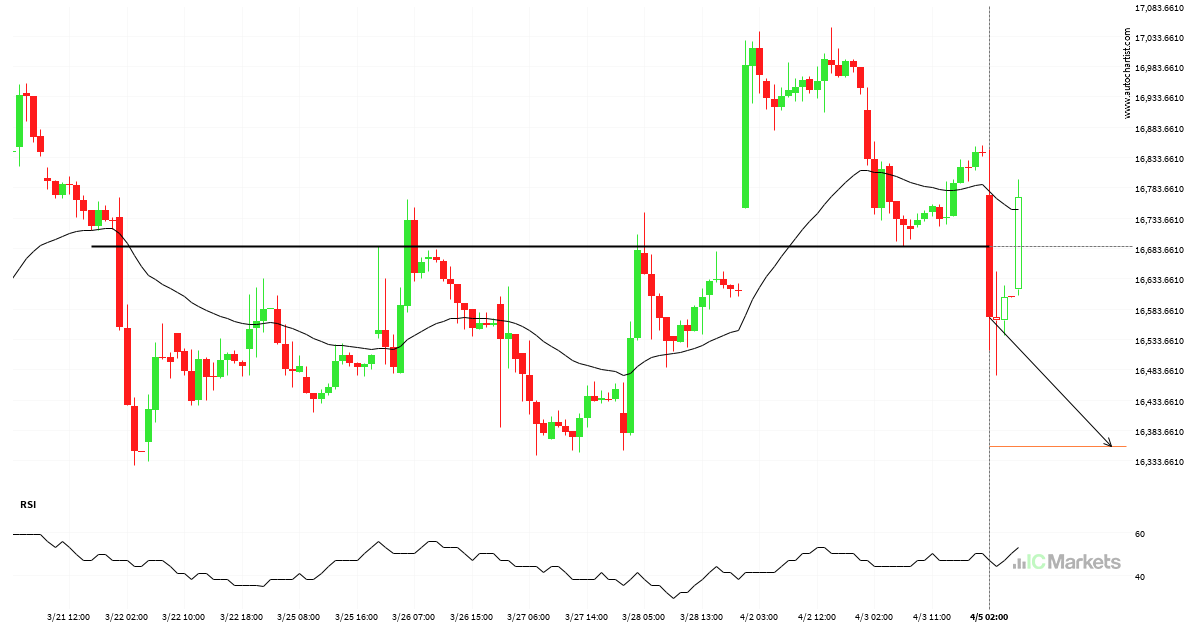
Hong Kong 50 Index short term bearish trade setup to 16489.7500
A strong support level has been identified at 16489.7500 on the 30 Minutes Hong Kong 50 Index chart. Hong Kong 50 Index is likely to test it soon.
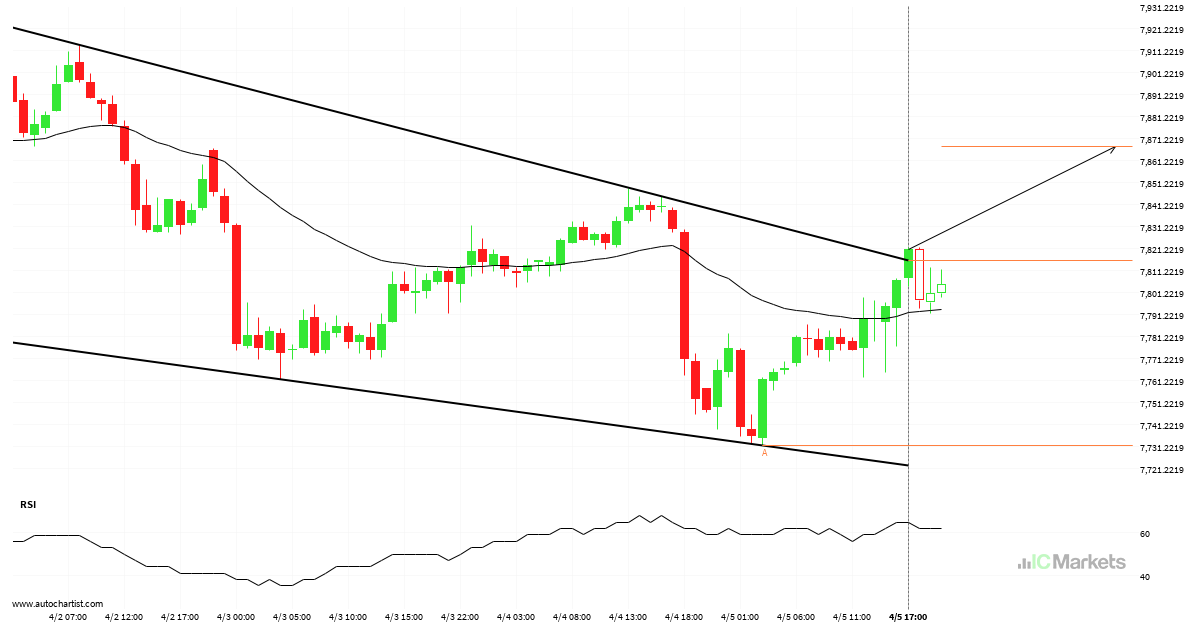
Falling Wedge breakout on Australia 200 Index
Australia 200 Index has broken through a resistance line of a Falling Wedge and suggests a possible movement to 7867.5712 within the next 21 hours. It has tested this line in the past, so one should probably wait for a confirmation of this breakout before taking action. If the breakout doesn’t confirm, we could see […]
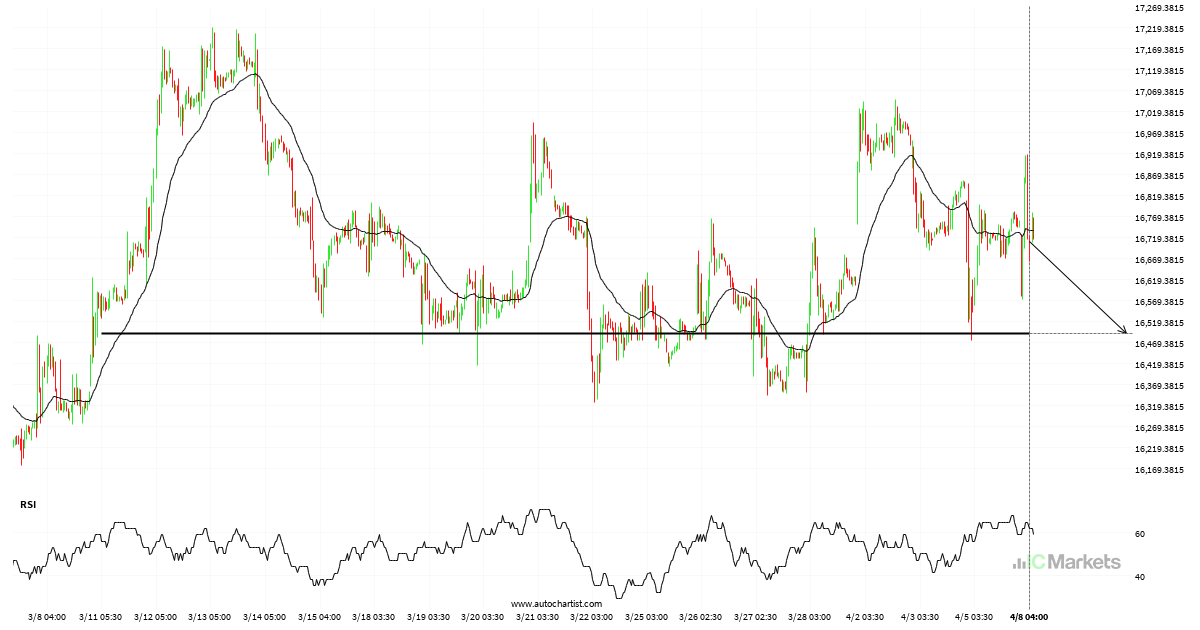
Important price line breached by Hong Kong 50 Index
Hong Kong 50 Index has broken through a line of 16686.6895. If this breakout holds true, we could see the price of Hong Kong 50 Index heading towards 16357.6943 within the next 2 days. But don’t be so quick to trade, it has tested this line numerous times in the past, so you should probably […]
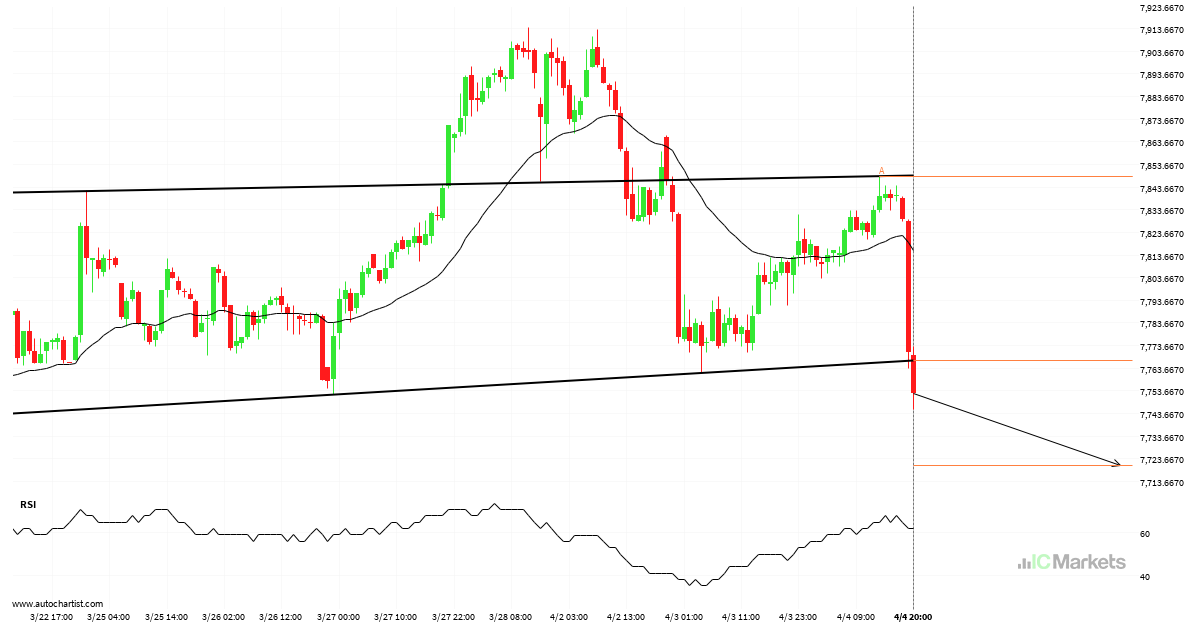
bearish technical pattern on Australia 200 Index 1 hour
You would be well advised to confirm the breakout that has just occurred – do you believe the move through support to be significant? Do you have confirming indicators that the price momentum will continue? If so, look for a target of 7720.8702 but consider reducing the size of your position as the price gets […]
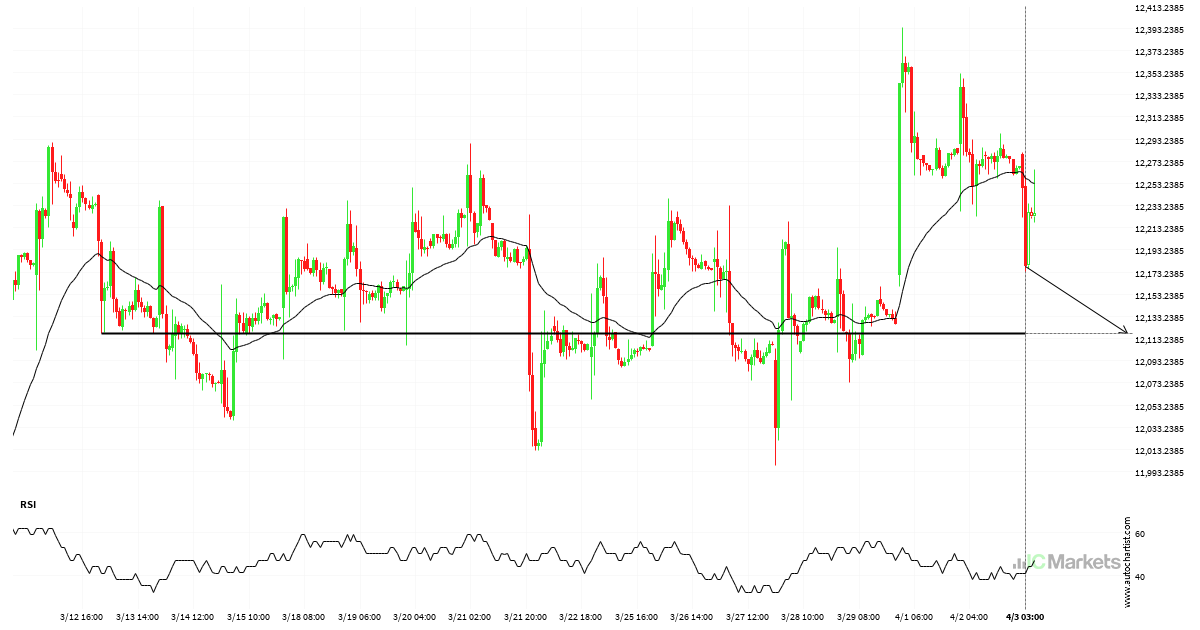
Breach of important price line imminent by FTSE China A50 Index
FTSE China A50 Index is moving towards a key support level at 12117.5000. This is a previously tested level for FTSE China A50 Index. This could be a good trading opportunity, either at the spot price, or after breaching this level.